
|
"God is not external to anyone, but is present with all things, though they are ignorant that he is so."
Plotinus |
Mobility
It's one of the grand term nowadays - and for me "mobility" isn't just about bringing my body from A to B, but also covers an intellectual and spiritual dimension. Here on the physical the mobility, since the invention of steam engines broughts us many blessings but curses as well. Many wars are fought and will be fought to secure the sources of fuels to provide and maintain predominantly fossile based mobility.
The last years my approach to life has been about becoming "lighter" and more "flexible" - one as aspect what about mobile living, e.g. temporary buildings Energy UsageSome numbers for common ways to be mobile for one person (80kg), energy usage for a 100km way, and some additional numbers for comparison:
Whereas 3.785l = 1 gallon, 1 mile = 1.609344km, 1l gas ~ 8000 kcal, 1 gallon gas ~ 28,000 kcal, 1kWh ~ 0.1l gas ~ 800kcal, 1 kcal = 4.148 kJ Disclaimer: not all numbers haven been verified with 2nd and 3rd sources yet.
Sources:
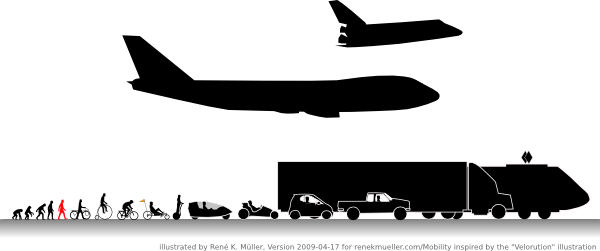
Wikipedia: Fuel Efficiency in Transportation What can you do with all those numbers? Well, the relative comparison shows you how efficient the engine actually is compared to the human body. Interestingly the bicycle and recumbent are more efficient. Another interesting number which relates closely to this efficiency is the ratio of the vehicle vs the body carried, as example walking and running requires only clothing, or a bicycle is 1/8 of the weight of the body whereas a car 18x heavier, this means much of the power is required to move the vehicle, and only 1/18 of the energy used to transport the body. It also matters what purpose a vehicle has, e.g. the truck unloaded is a complete waste, whereas fully loaded becomes very efficient like a bicycle in regards vehicle/load (body). Energy- & Vehicle Efficiency & SpeedHere a graphical chart with the three main values:
Energy Efficiencydisplayed 1/e (greater the better)
Vehicle/Body Ratiodisplayed log(r) (smaller the better)
Speeddisplayed log(e)
Energy: Food vs GasYou may think, "oh, we know, bicycle riding is better for the planet than driving a car, so what!". Well, interestingly, producing food to ride a bicyle takes more energy than providing the gas to drive the car! Various sites discuss this, like worth reading. The conclusion isn't to drive the car instead to ride a bicycle, but to extend the picture to how we produce food (e.g. vegetarian lifestyle). In a way, mobility can't be just focused on the energy usage, but also how the energy became available - the use of energy to provide energy. For every 1kcal food produced in US argiculture 10kcal oil/gas was used. One could conclude we are paying 90% for the energy to produce it, and only 10% for the product as such! How many kcal were used to produce to provide 1l gas? One could argue or conclude roughly in a market-economy that the overall energy is expressed in the "cost" actually which covers all costs to produce this energy form, e.g. the price of 1l gas includes all costs, the same food includes all costs - I'm aware gas includes taxes which are used to subsidize other costs, e.g. building streets or welfare which differs for each country; and speculative influence on gas and nowadays food as well distort this picture further. I used apprx. € 4 per day for food (incl. water) while riding a 7500km long trip in May and June 2008, riding 51 days, with rest days included 62 days, averaging 147km per day. To cover 147km per day with a car, with 7l/100km, diesel costs CHF 2.20/l (2008/09) which gives CHF 23.10 or € 14. So, apprx. 557% or 5.5x for the car compared to the recumbent - of course if 4 people would ride with the car, the costs would come down to 140% or 1.4x. Of course in the detail the food in order to be functional to ride a car should be included as well - a vehicle (body) maneuvering another vehicle (car). Aside of the energy usage to produce energy is the sustainability are very important aspect of this consideration too - does gas grow on trees? What about gas produced from growing plants, and that area used for those plants not available for food production and thereby makes food more expensive in the long term? Right now (2008) only 5% of all area is used to grow plants for fuel production, but this will change along the increasing price of fossil fuels. It is a complex system to provide physical mobility: streets, vehicles, fuel, and food. .:.
|


